💼 Case Studies
Examples of my experience as a Design Leader
- Org Growth and Scaling
- eCommerce Strategy & Design
- Player-coach
- Leading AI Adoption
- Leveraging Discovery to Delivery
- Strategic Visioning
- Cross-functional Influence
- Modeling Craft and Acumen
- Service & Systems Design
- Contact Center research
- Research practice from scratch
- Strategic Partnership
- Design System leadership
🛠️ Projects & Products
Projects and Products I've led
My Experience
Visualizing Data within software
Making data meaningfully understandble and beautiful
👇 Skip the preamble and jump straight to the case study:
Across my career spanning advertising to product design leadership, I've focused on making data meaningfully understandable and beautiful. Visualizing data within a broder design, product or interface offers context in the style it adopts, however, it's critical to emphasize the reason for sharing the data in the first place - to inform decisions, tell a story, or drive action.
-
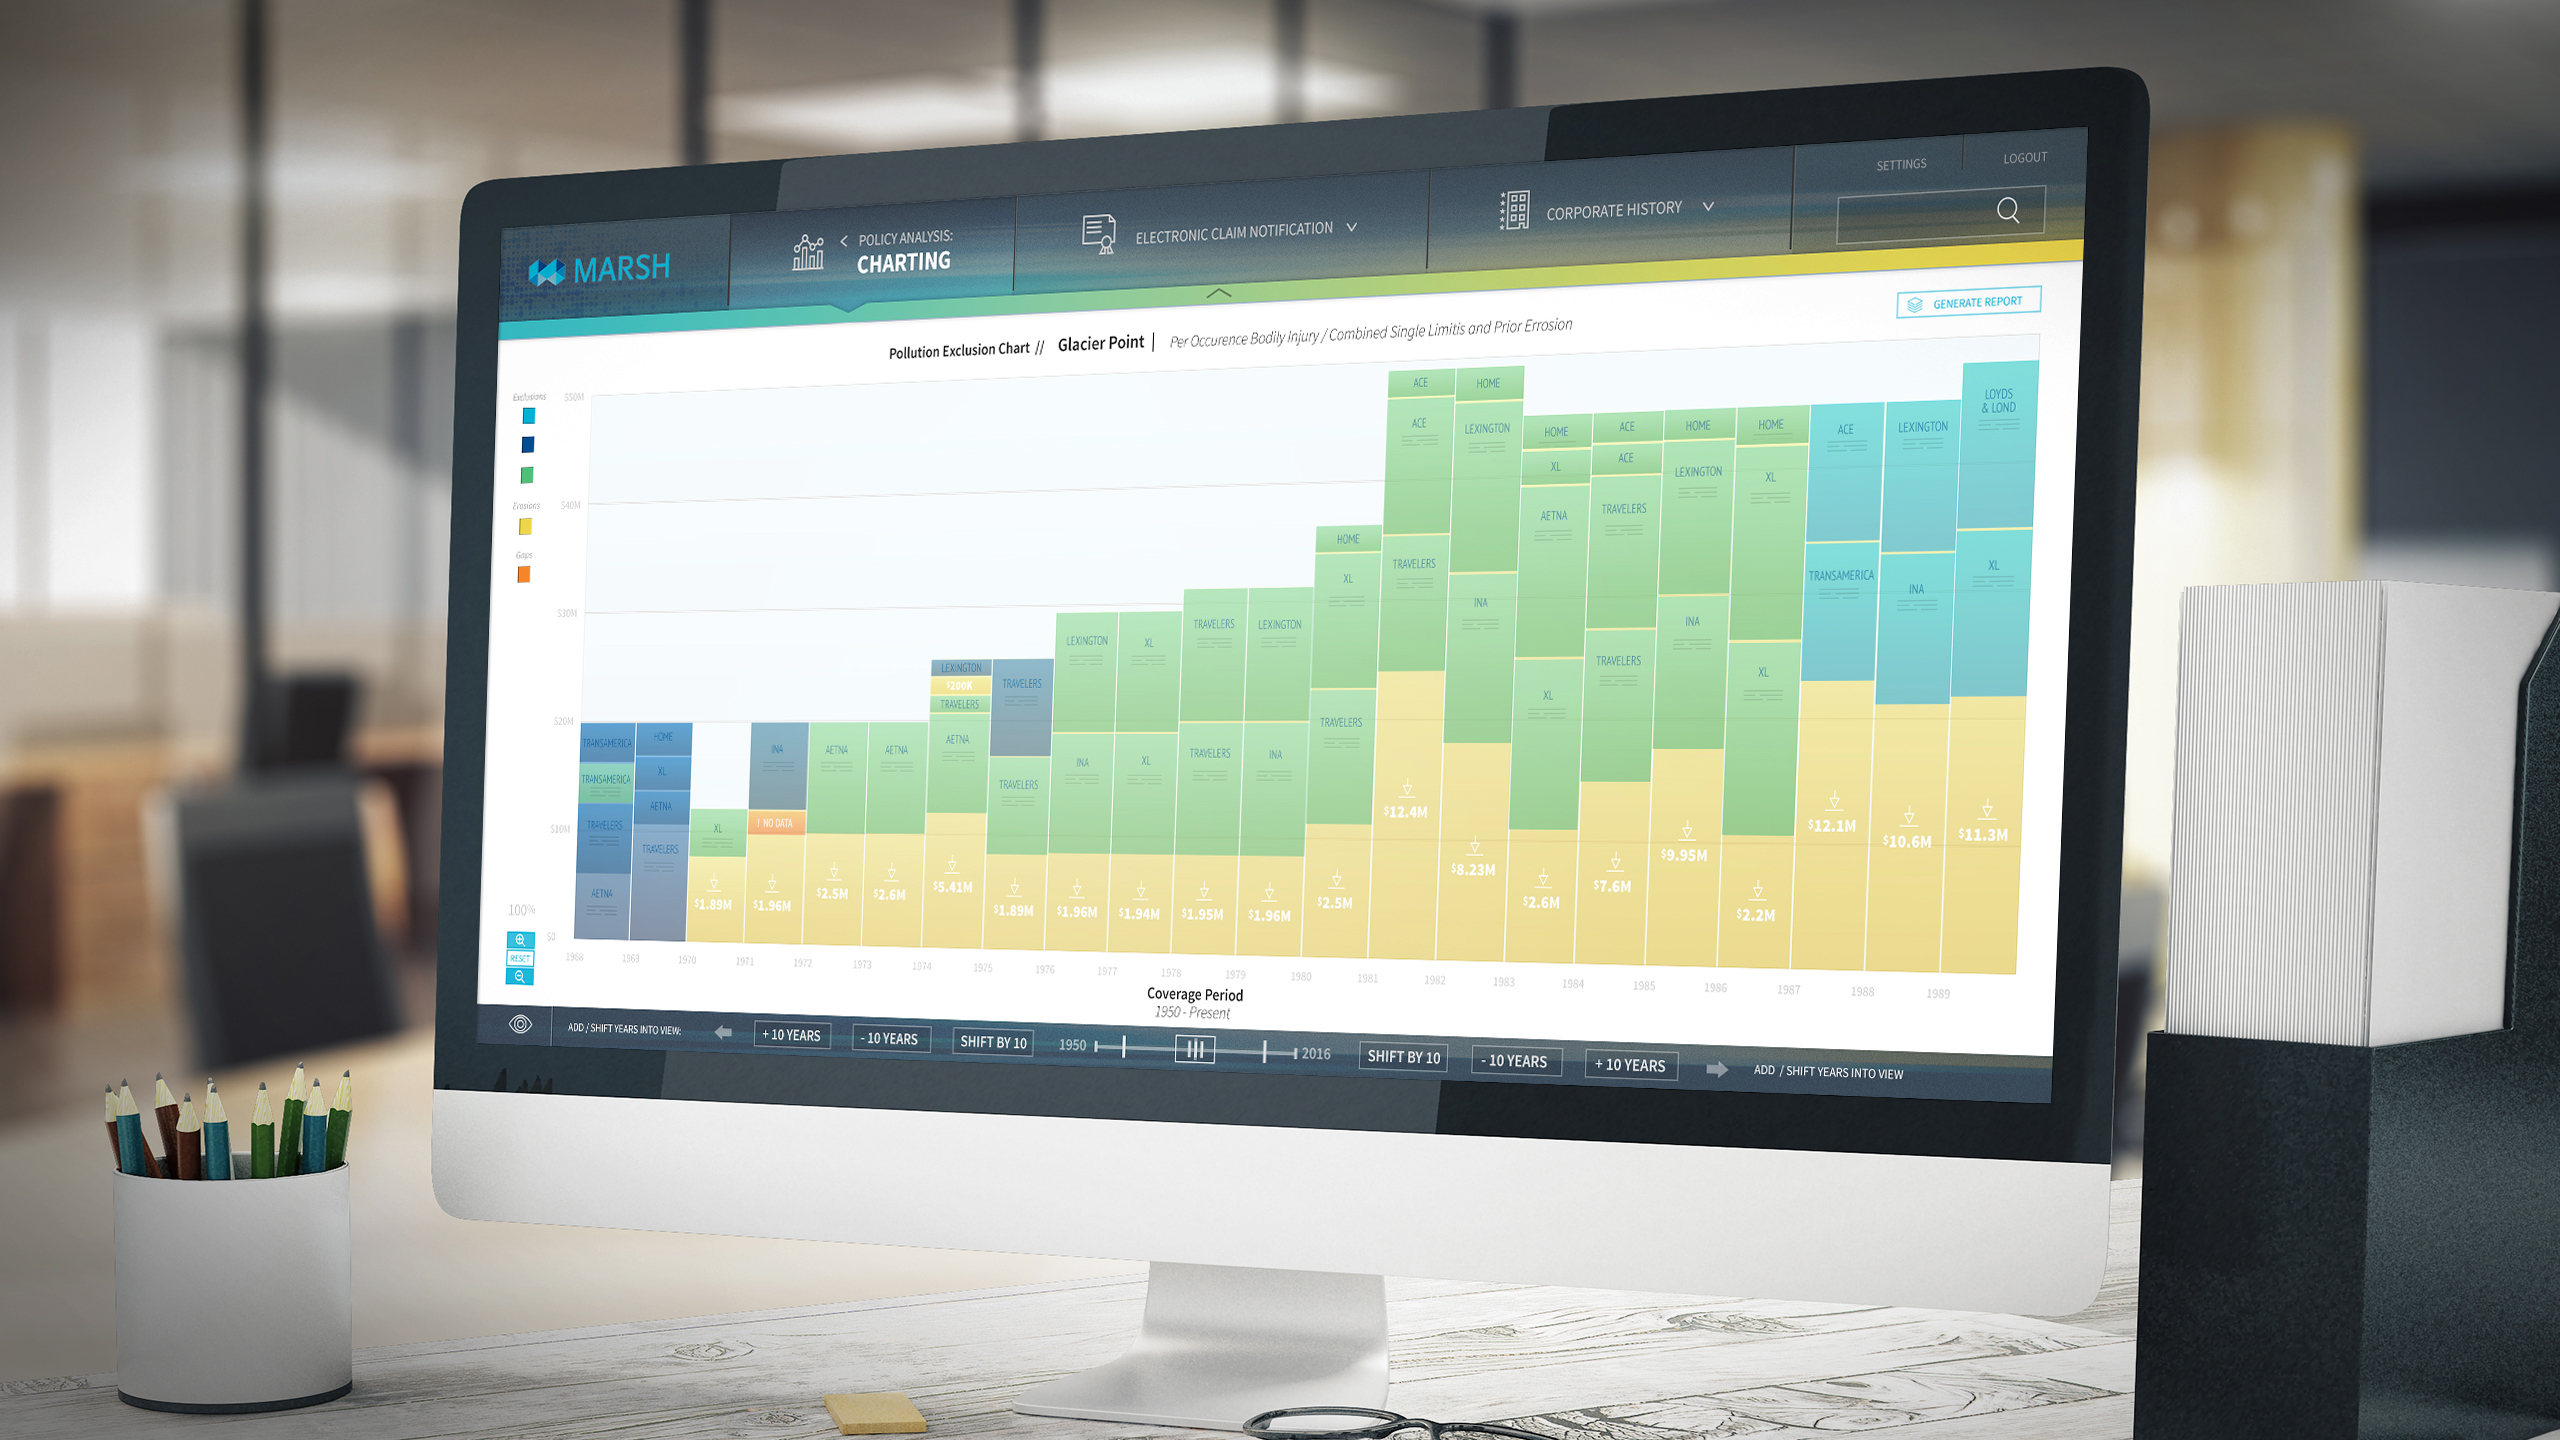
An interactive data visualization experience for Marsh.
🎨 Honed Aesthetic
Formed in Advertising, informed by data
✍️ Telling a story
through visualized data
🚗 Driving action
with compelling data
When telling a story leveraging data, it's critical to portray data as simply as possible. Across my experience, I've employed limited color palettes, motion design and strategic responsive and grid-based design to effectively communicate without overwhelming the audience.
-
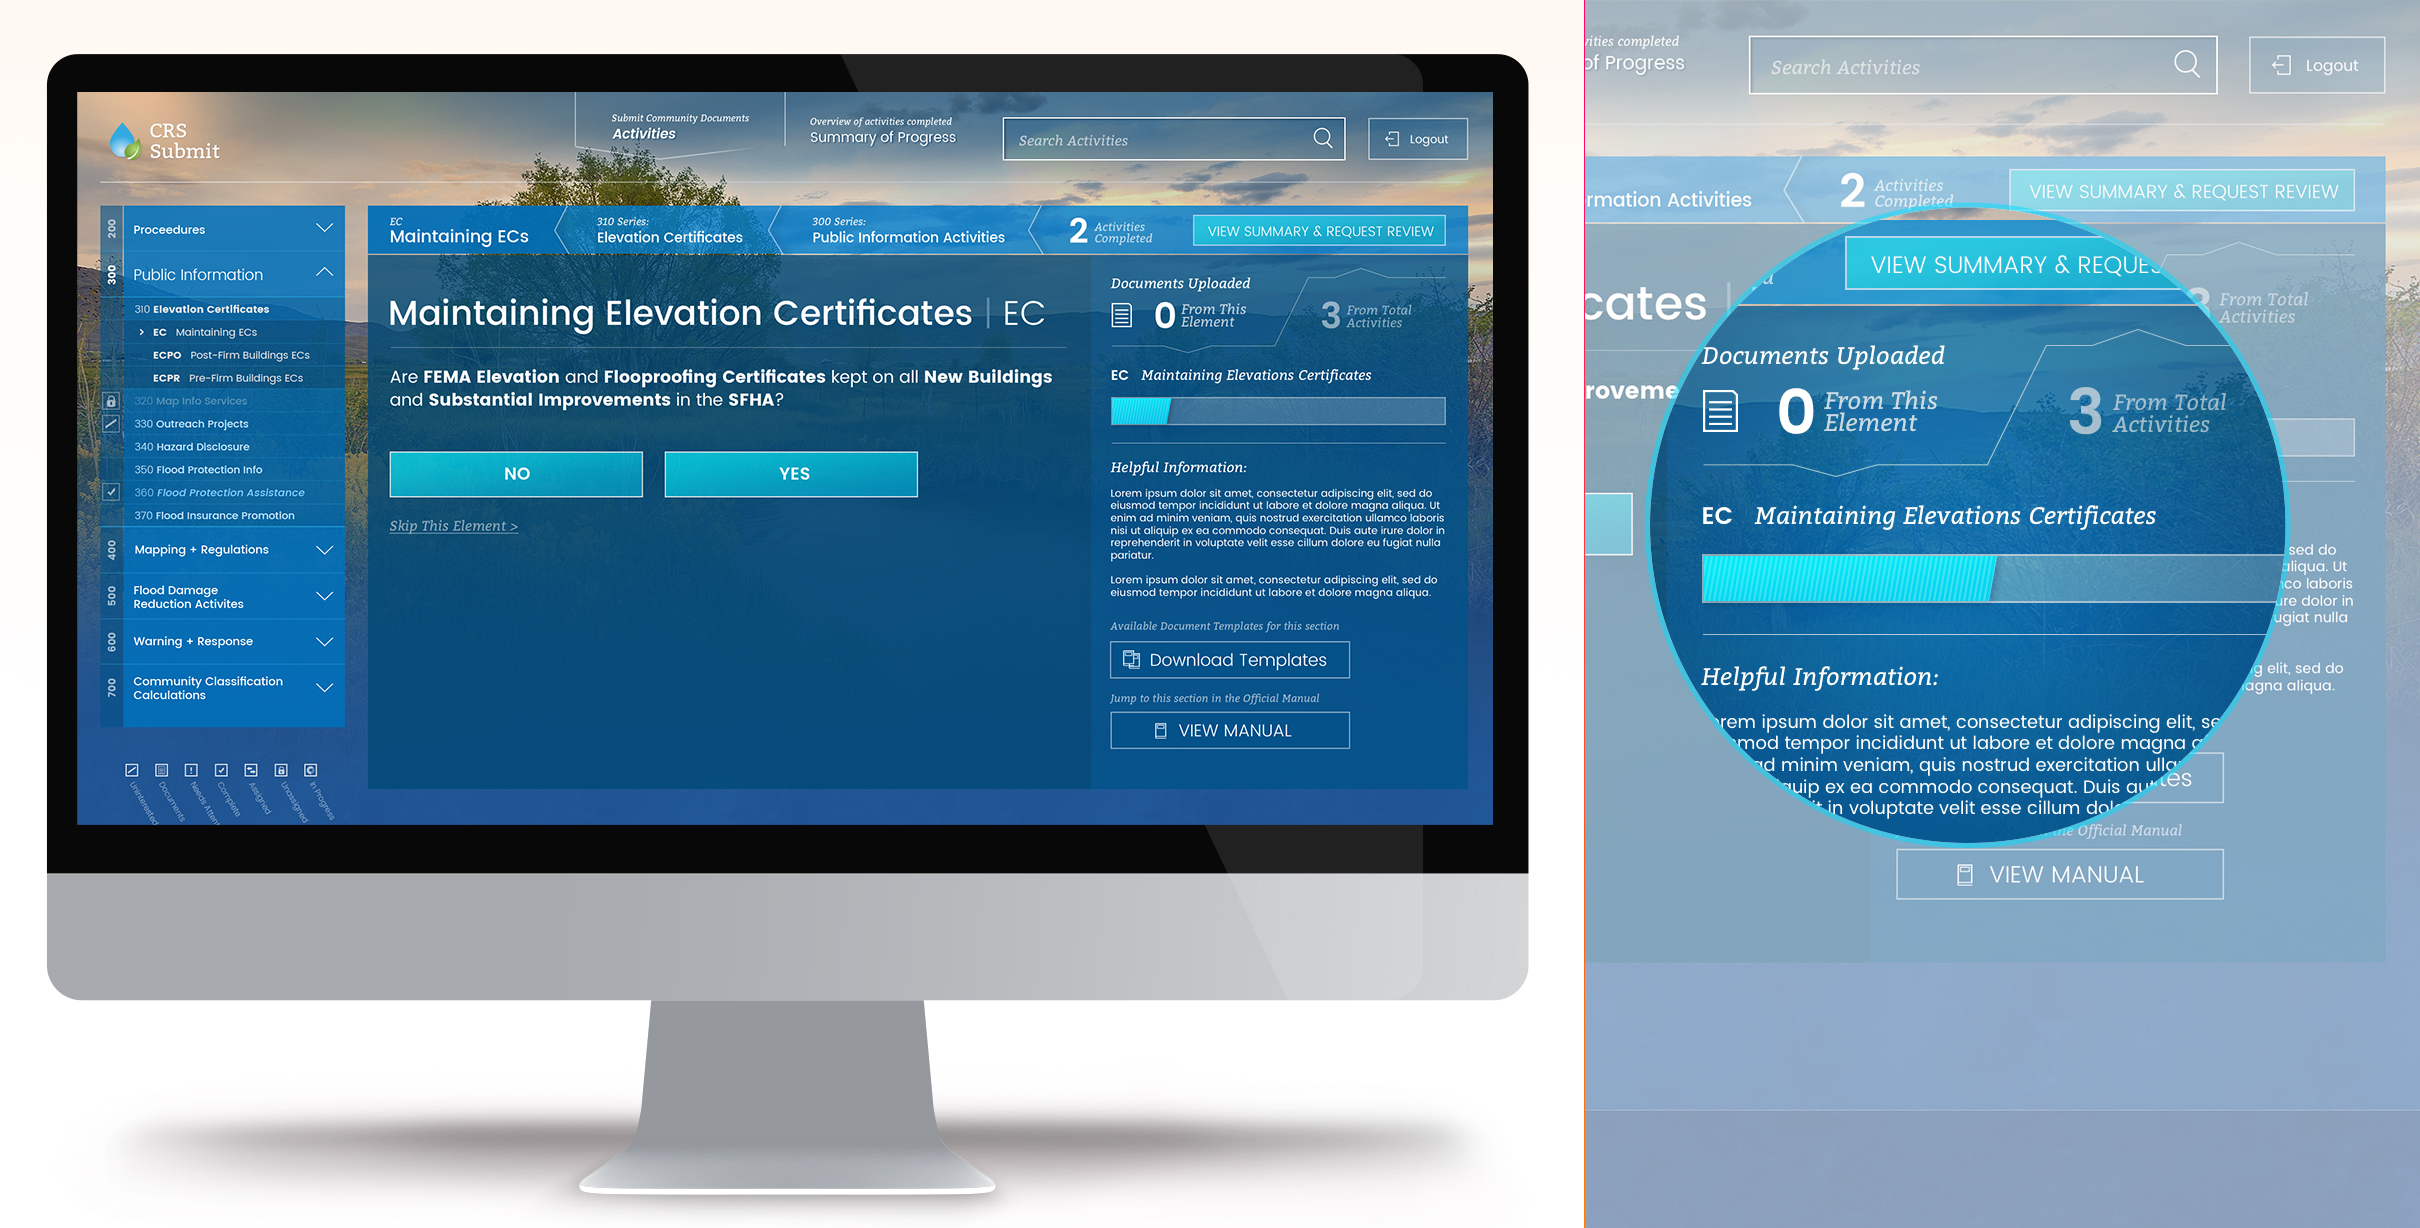
A custom application designed for FEMA's Community Rating System.
While at Exadel, FEMA approached us to assist with a Communty Rating System focused on Flood Preparedness. This application was a complex nest of dynamic forms and submission steps - where data become important to communicate progress and success throughout the expereince.
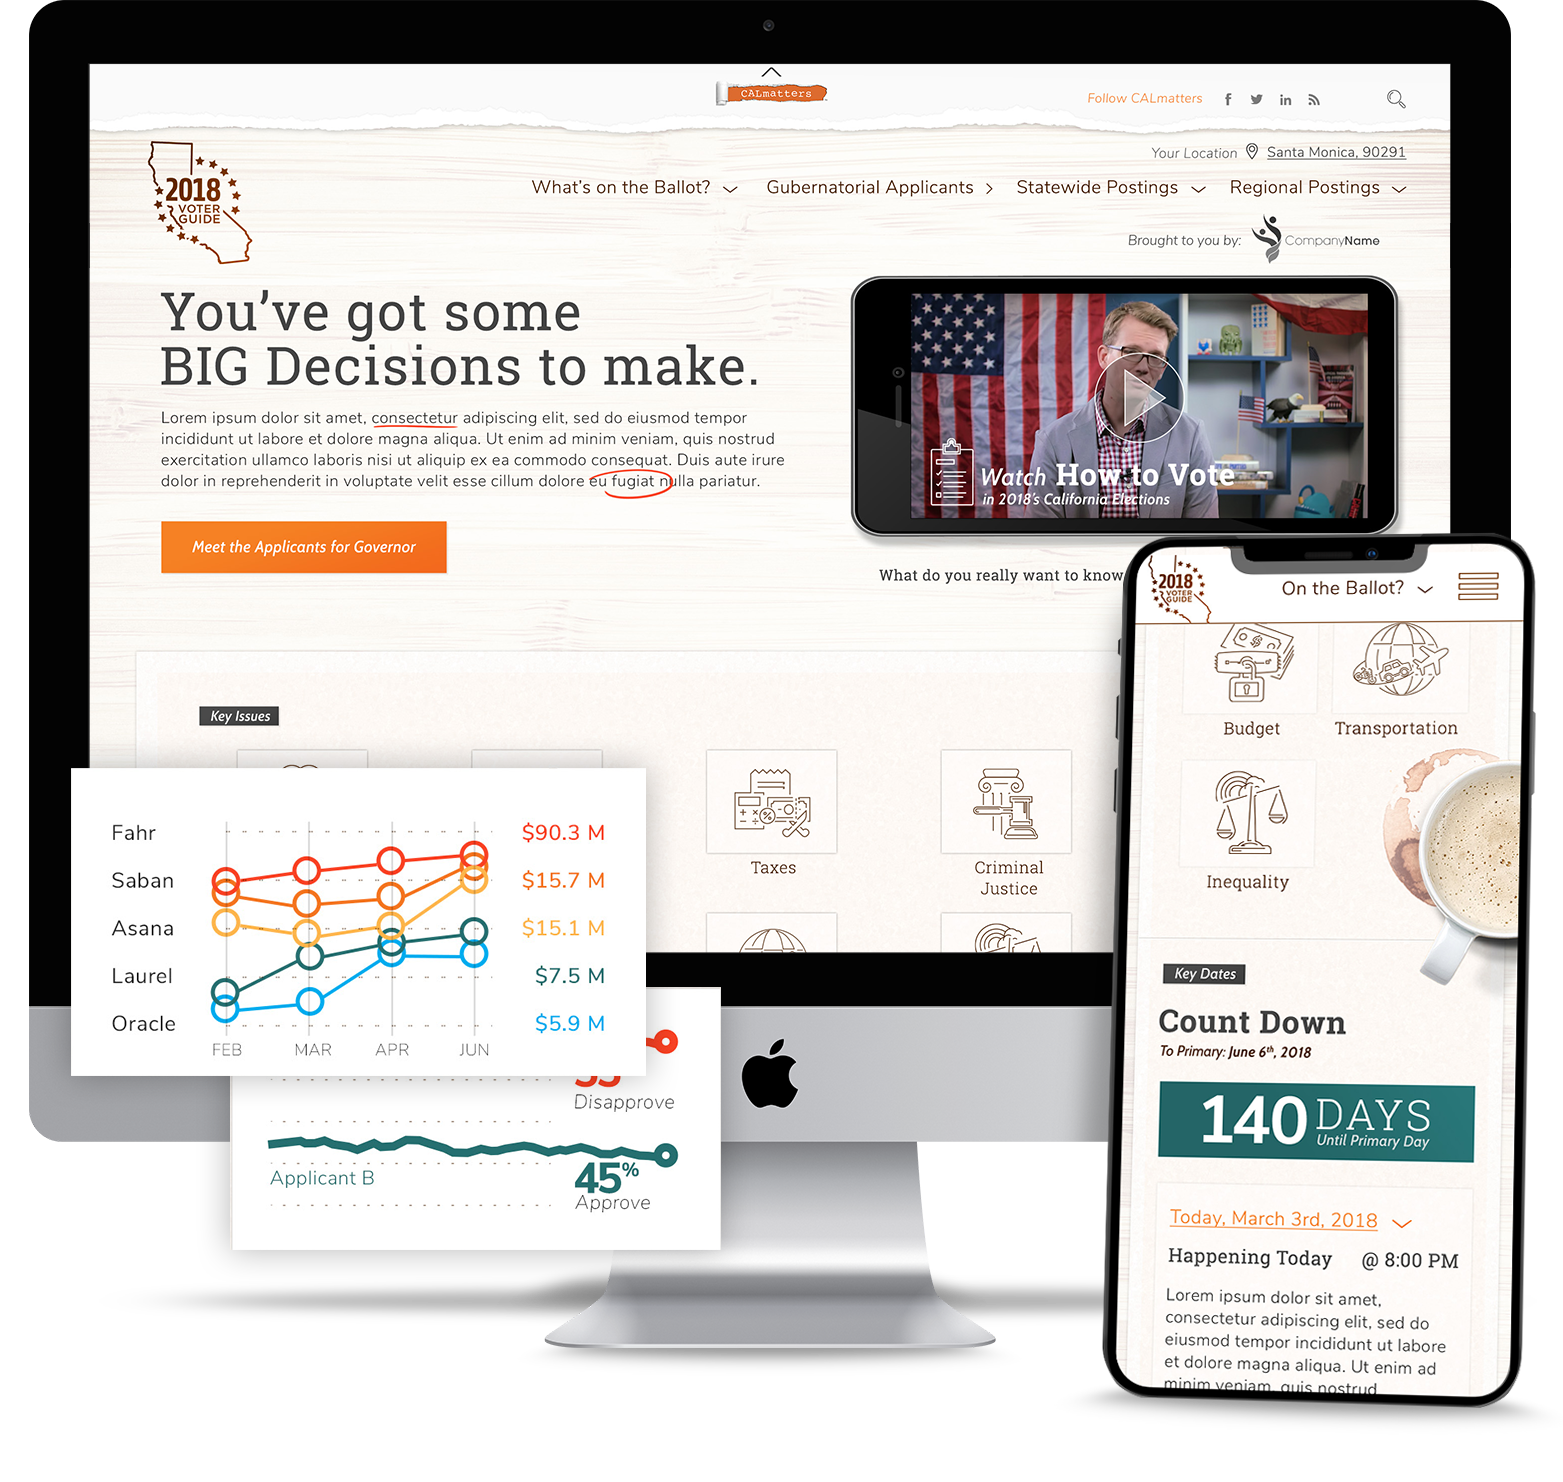
Another example of where I incorporated data visualization to enhance the overall experience was for an Election Guide project I led for CALMatters. Here, data supported the narrative of the impartial guide while offering live insights into the electoral process and ultimately empowering users to make informed decisions.
-
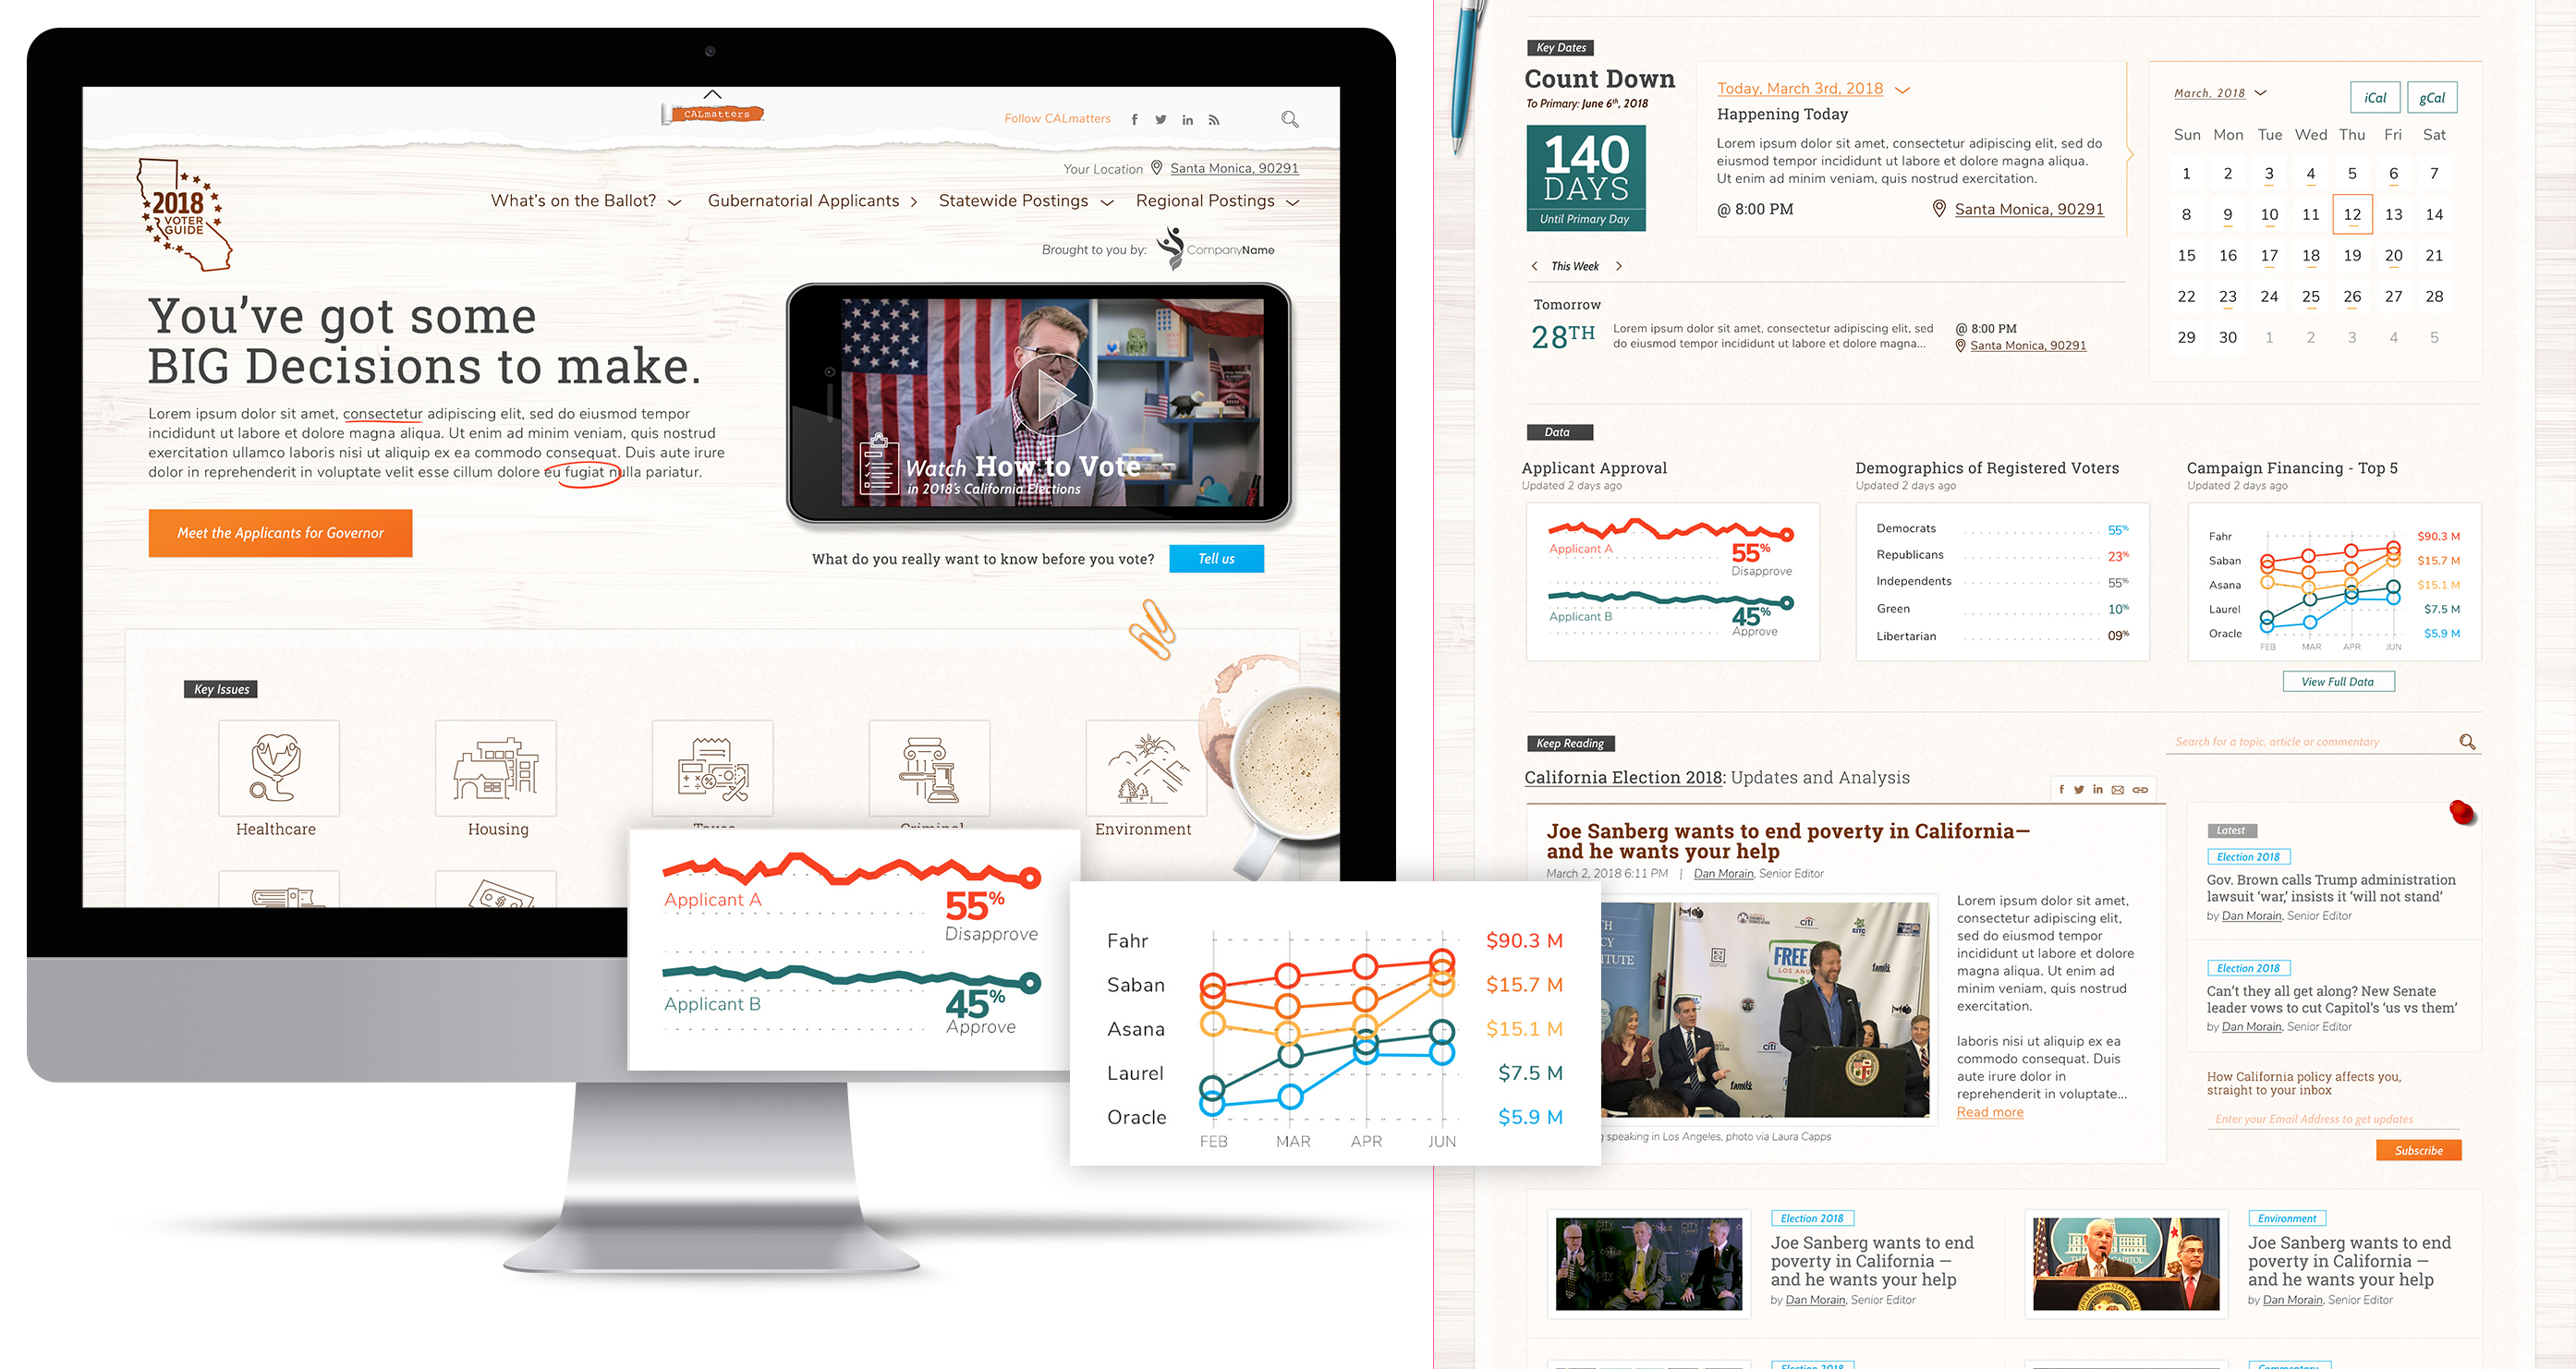
An editorial focused, election guide experience I led for CALMatters featured data relevant to polling and current political trends.

Here's an example of where Data was prioritized in the experience to empower action:
💼 Case:
-
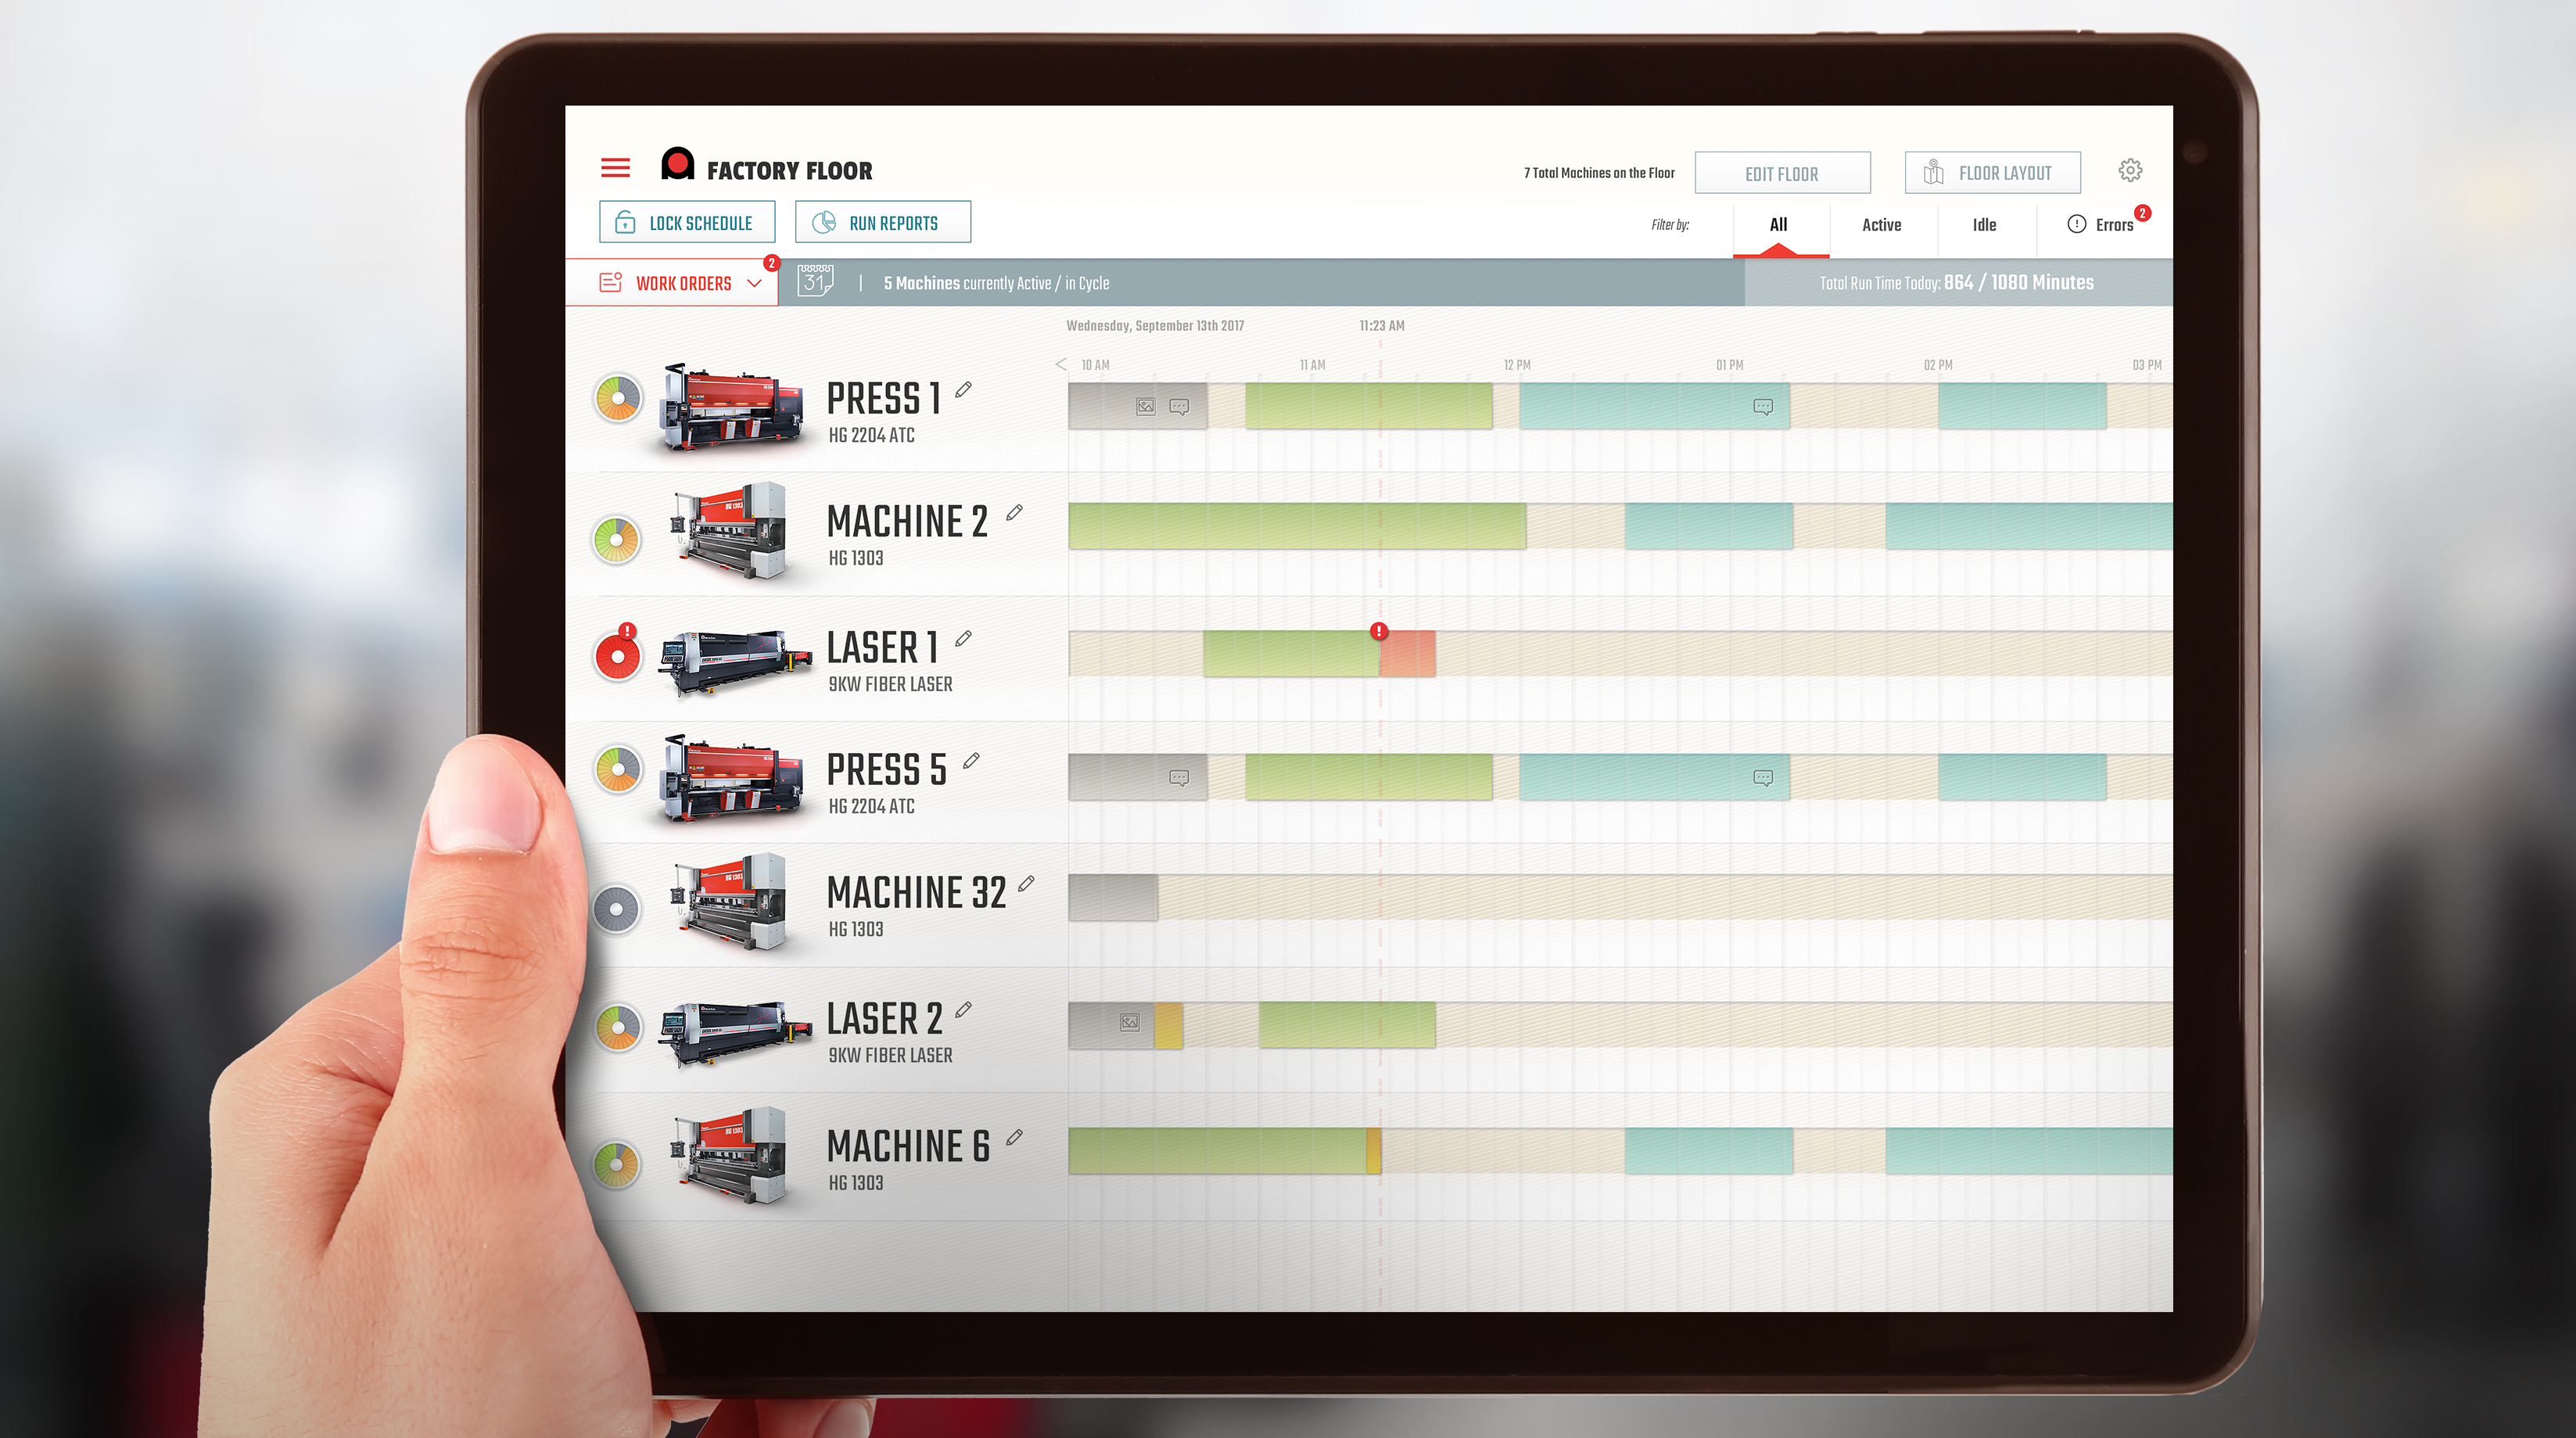
The concept was centered around seeing all manufacturing machinery within a factory setting in a software application.
At Exadel, I led design in a software consultancy environment. One project in particular was for a customer, Amada, who approached us in search of a manufacturing management platform, heavy on live, engaging and actionable data.
⚠️ The problem:
The challenge was to effectively visualize and present real-time data from multiple manufacturing machines in potentially varying states of operation and needed engagement or oversight.
-
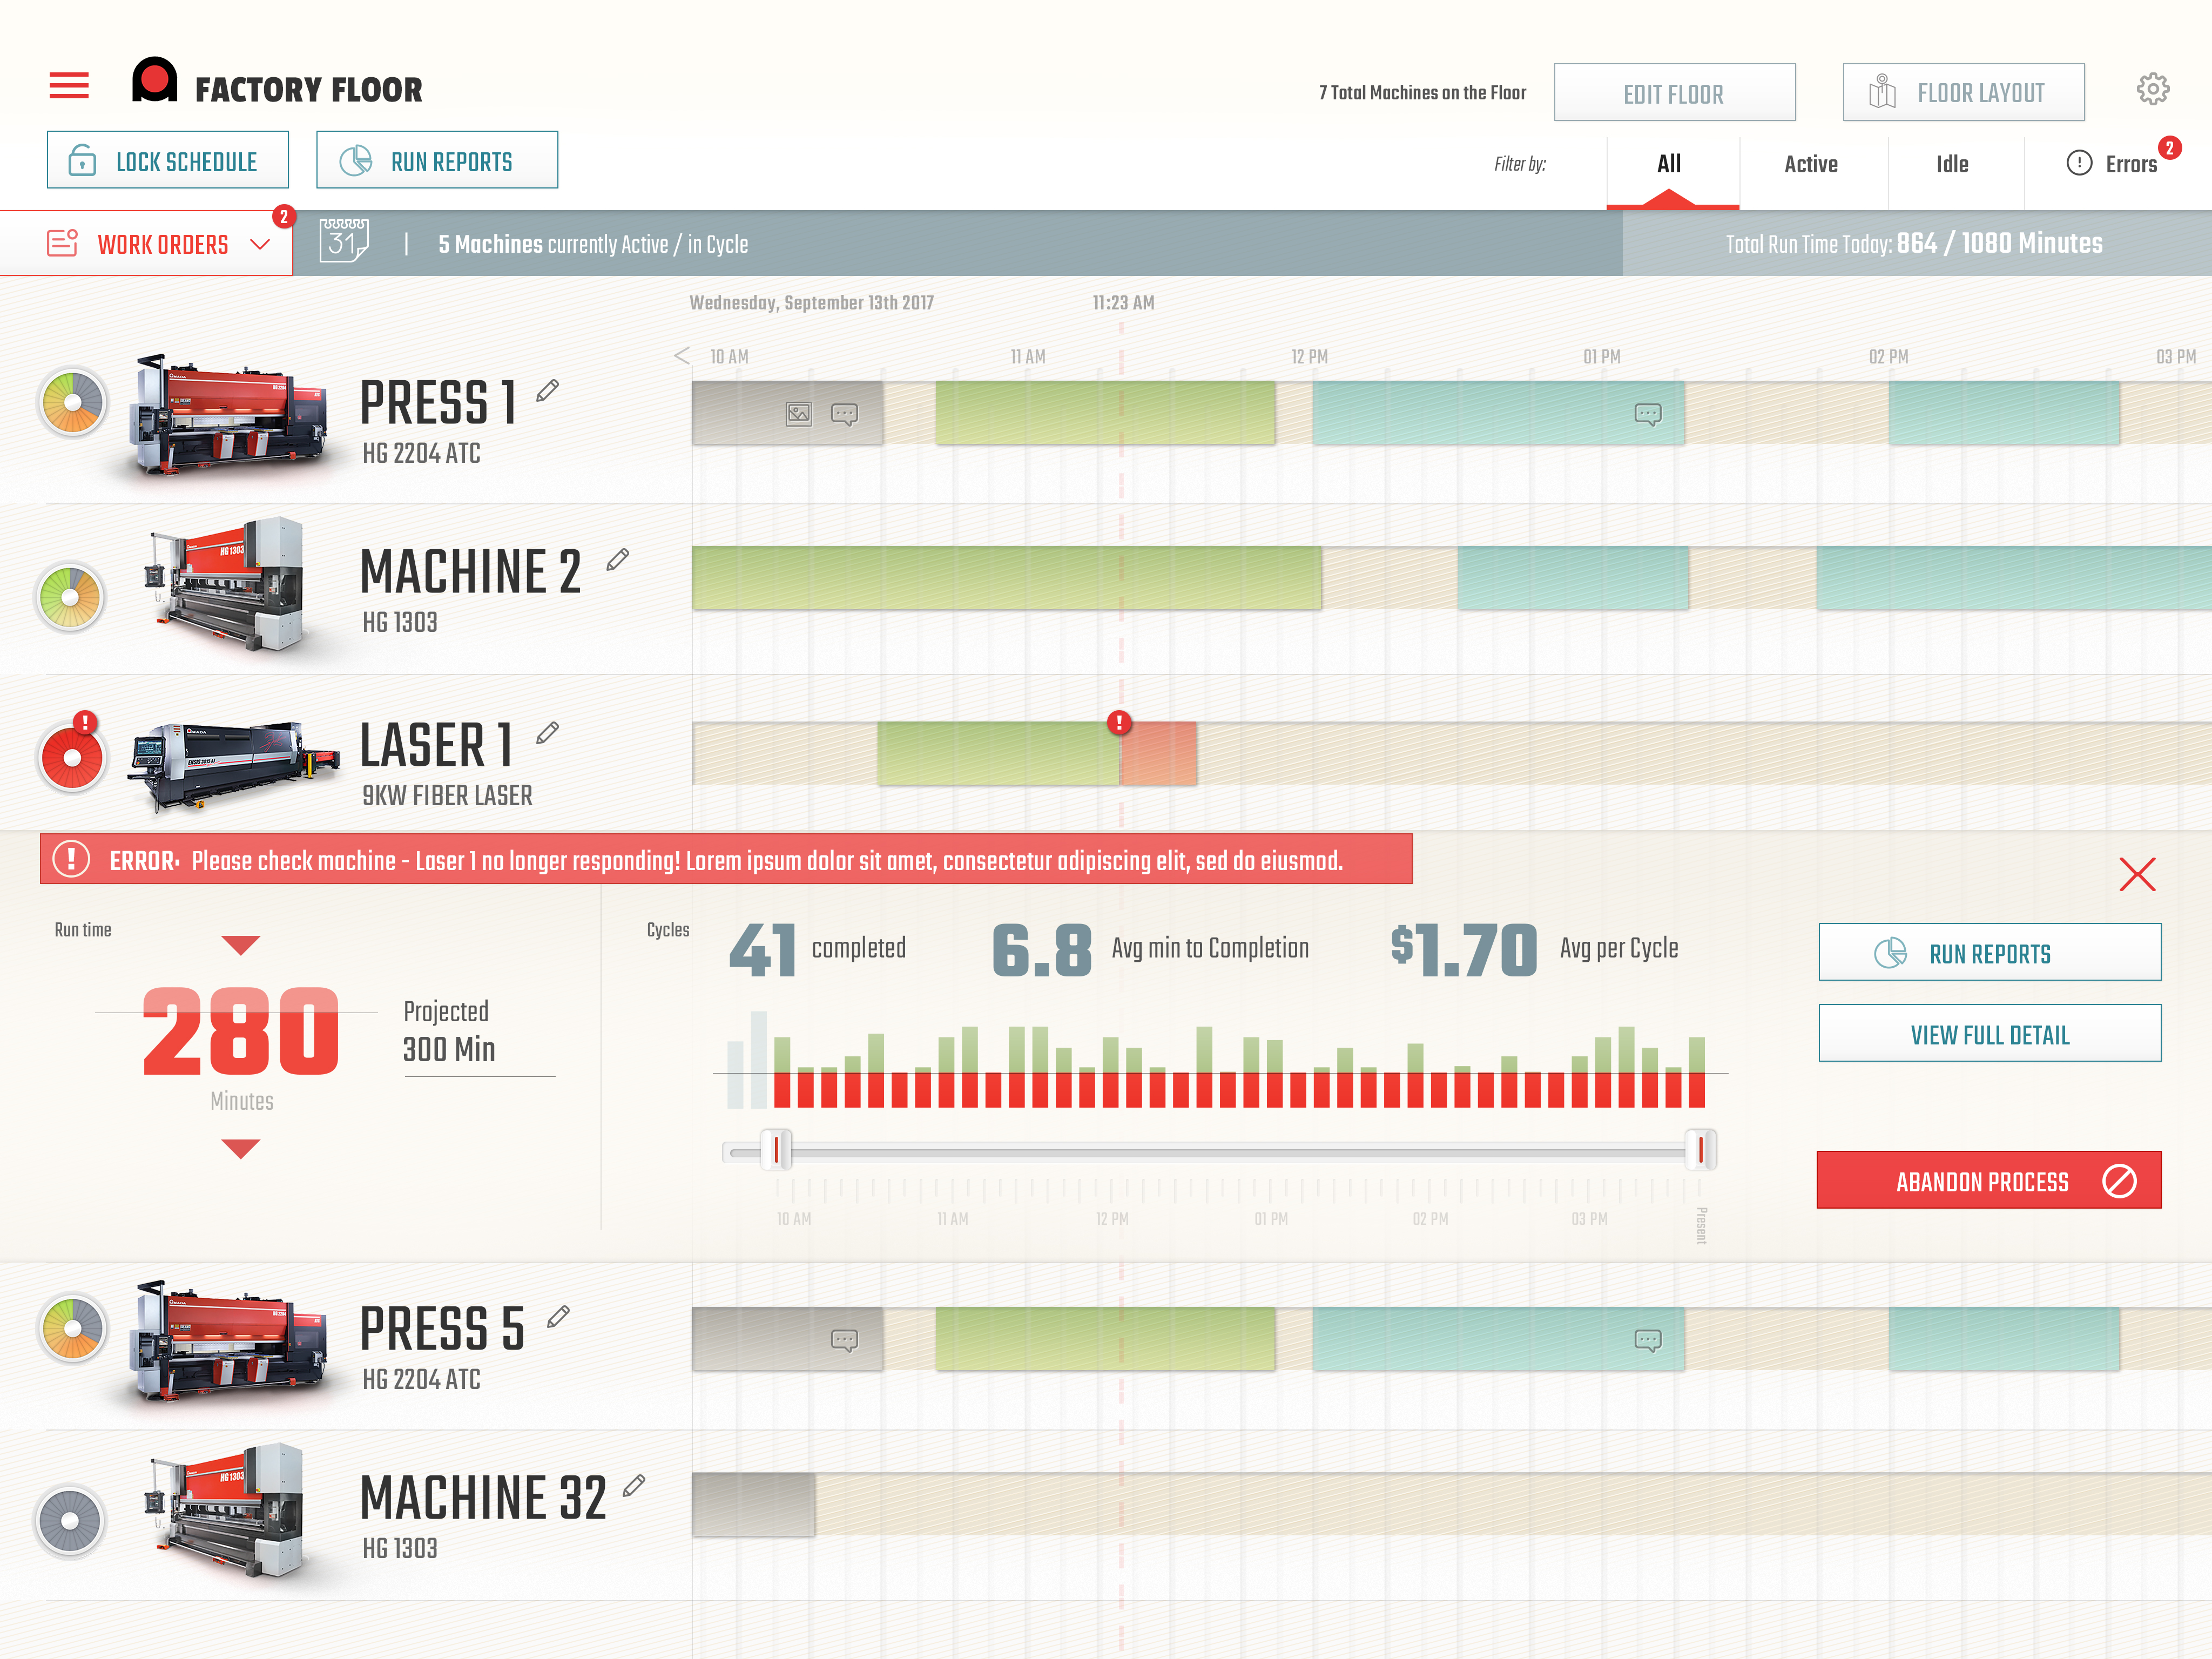
Here, an issue is shown, expanded for greater detail.
Not only was it important to generally see the machines in process, but also to understand trends in perfomance over time. This type of analysis was crucial for maintenance and optimization across the factory setting.
-
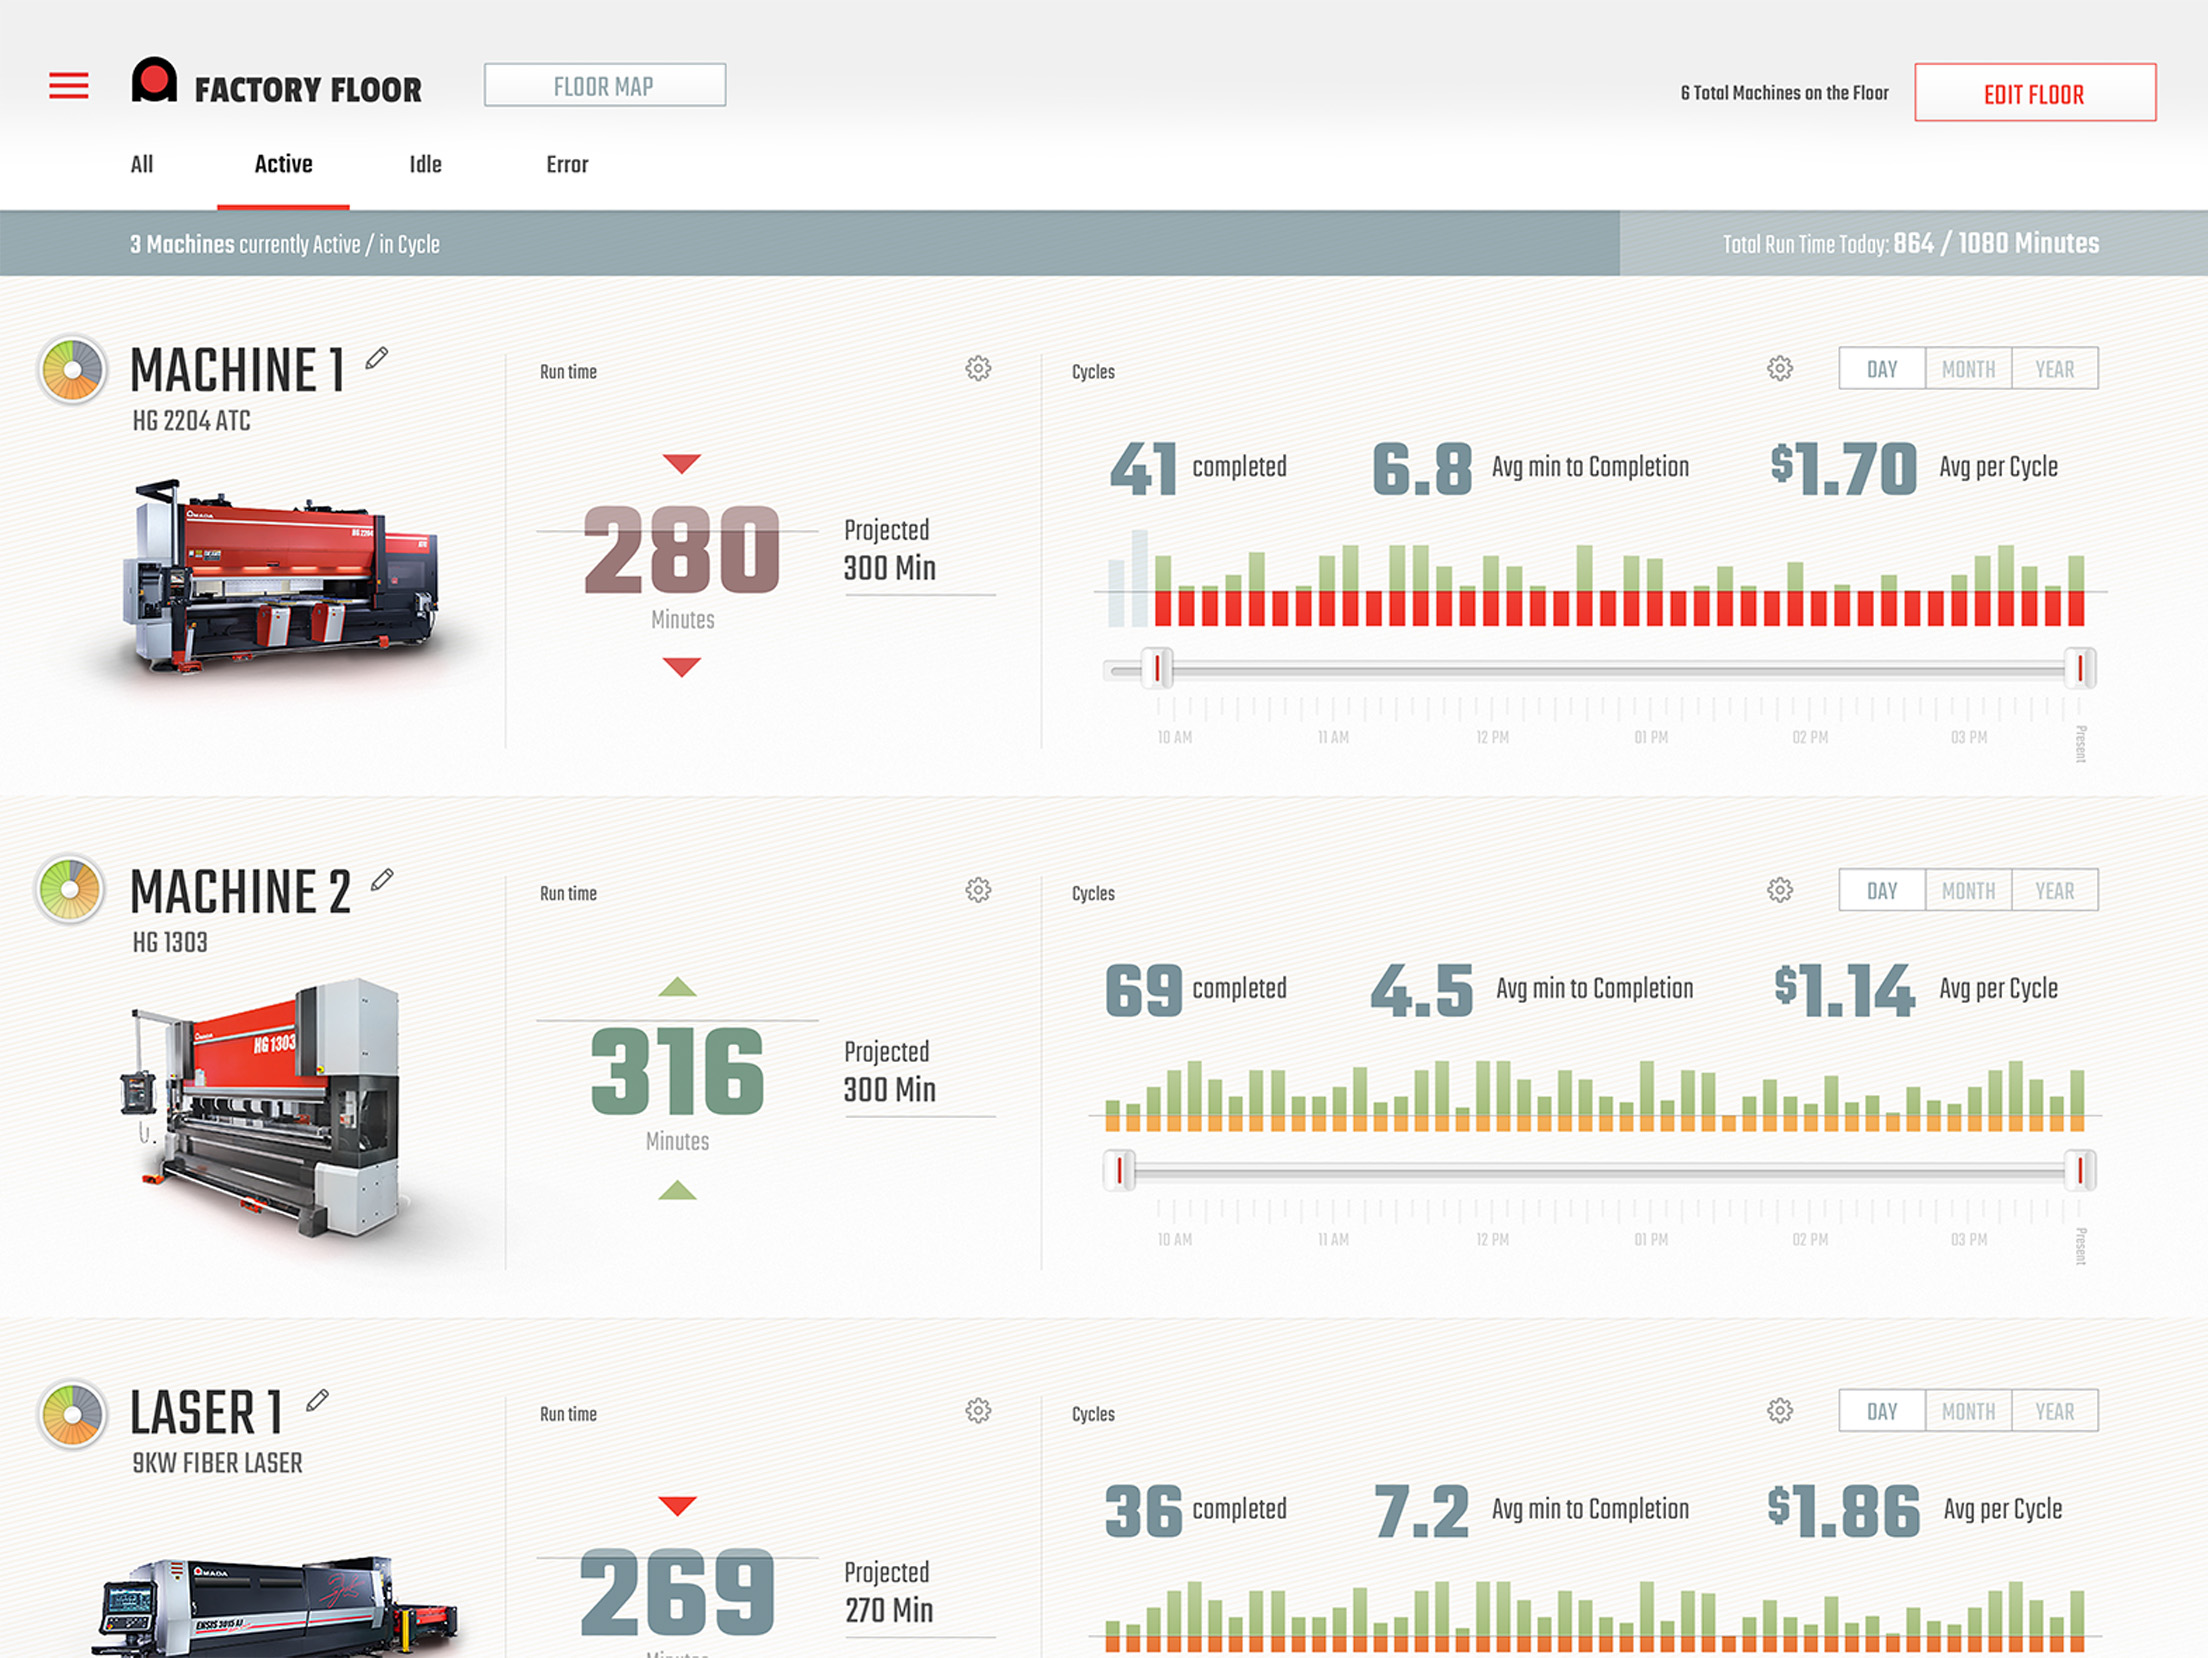
A view of trend data portrayed across the factory setting.
🛠️ Process:
Through typical Discovery processes, I led Exadel through becoming familiar with Amada's perspective on a manufacturing setting where their application could layer in.
As understanding grew of how machiines and processes might be occurring on a factory floor, I continued to work with the customer to understand the goals of the new application layer and how it could beneficially drive potential actions from factory users.
✅ Results:
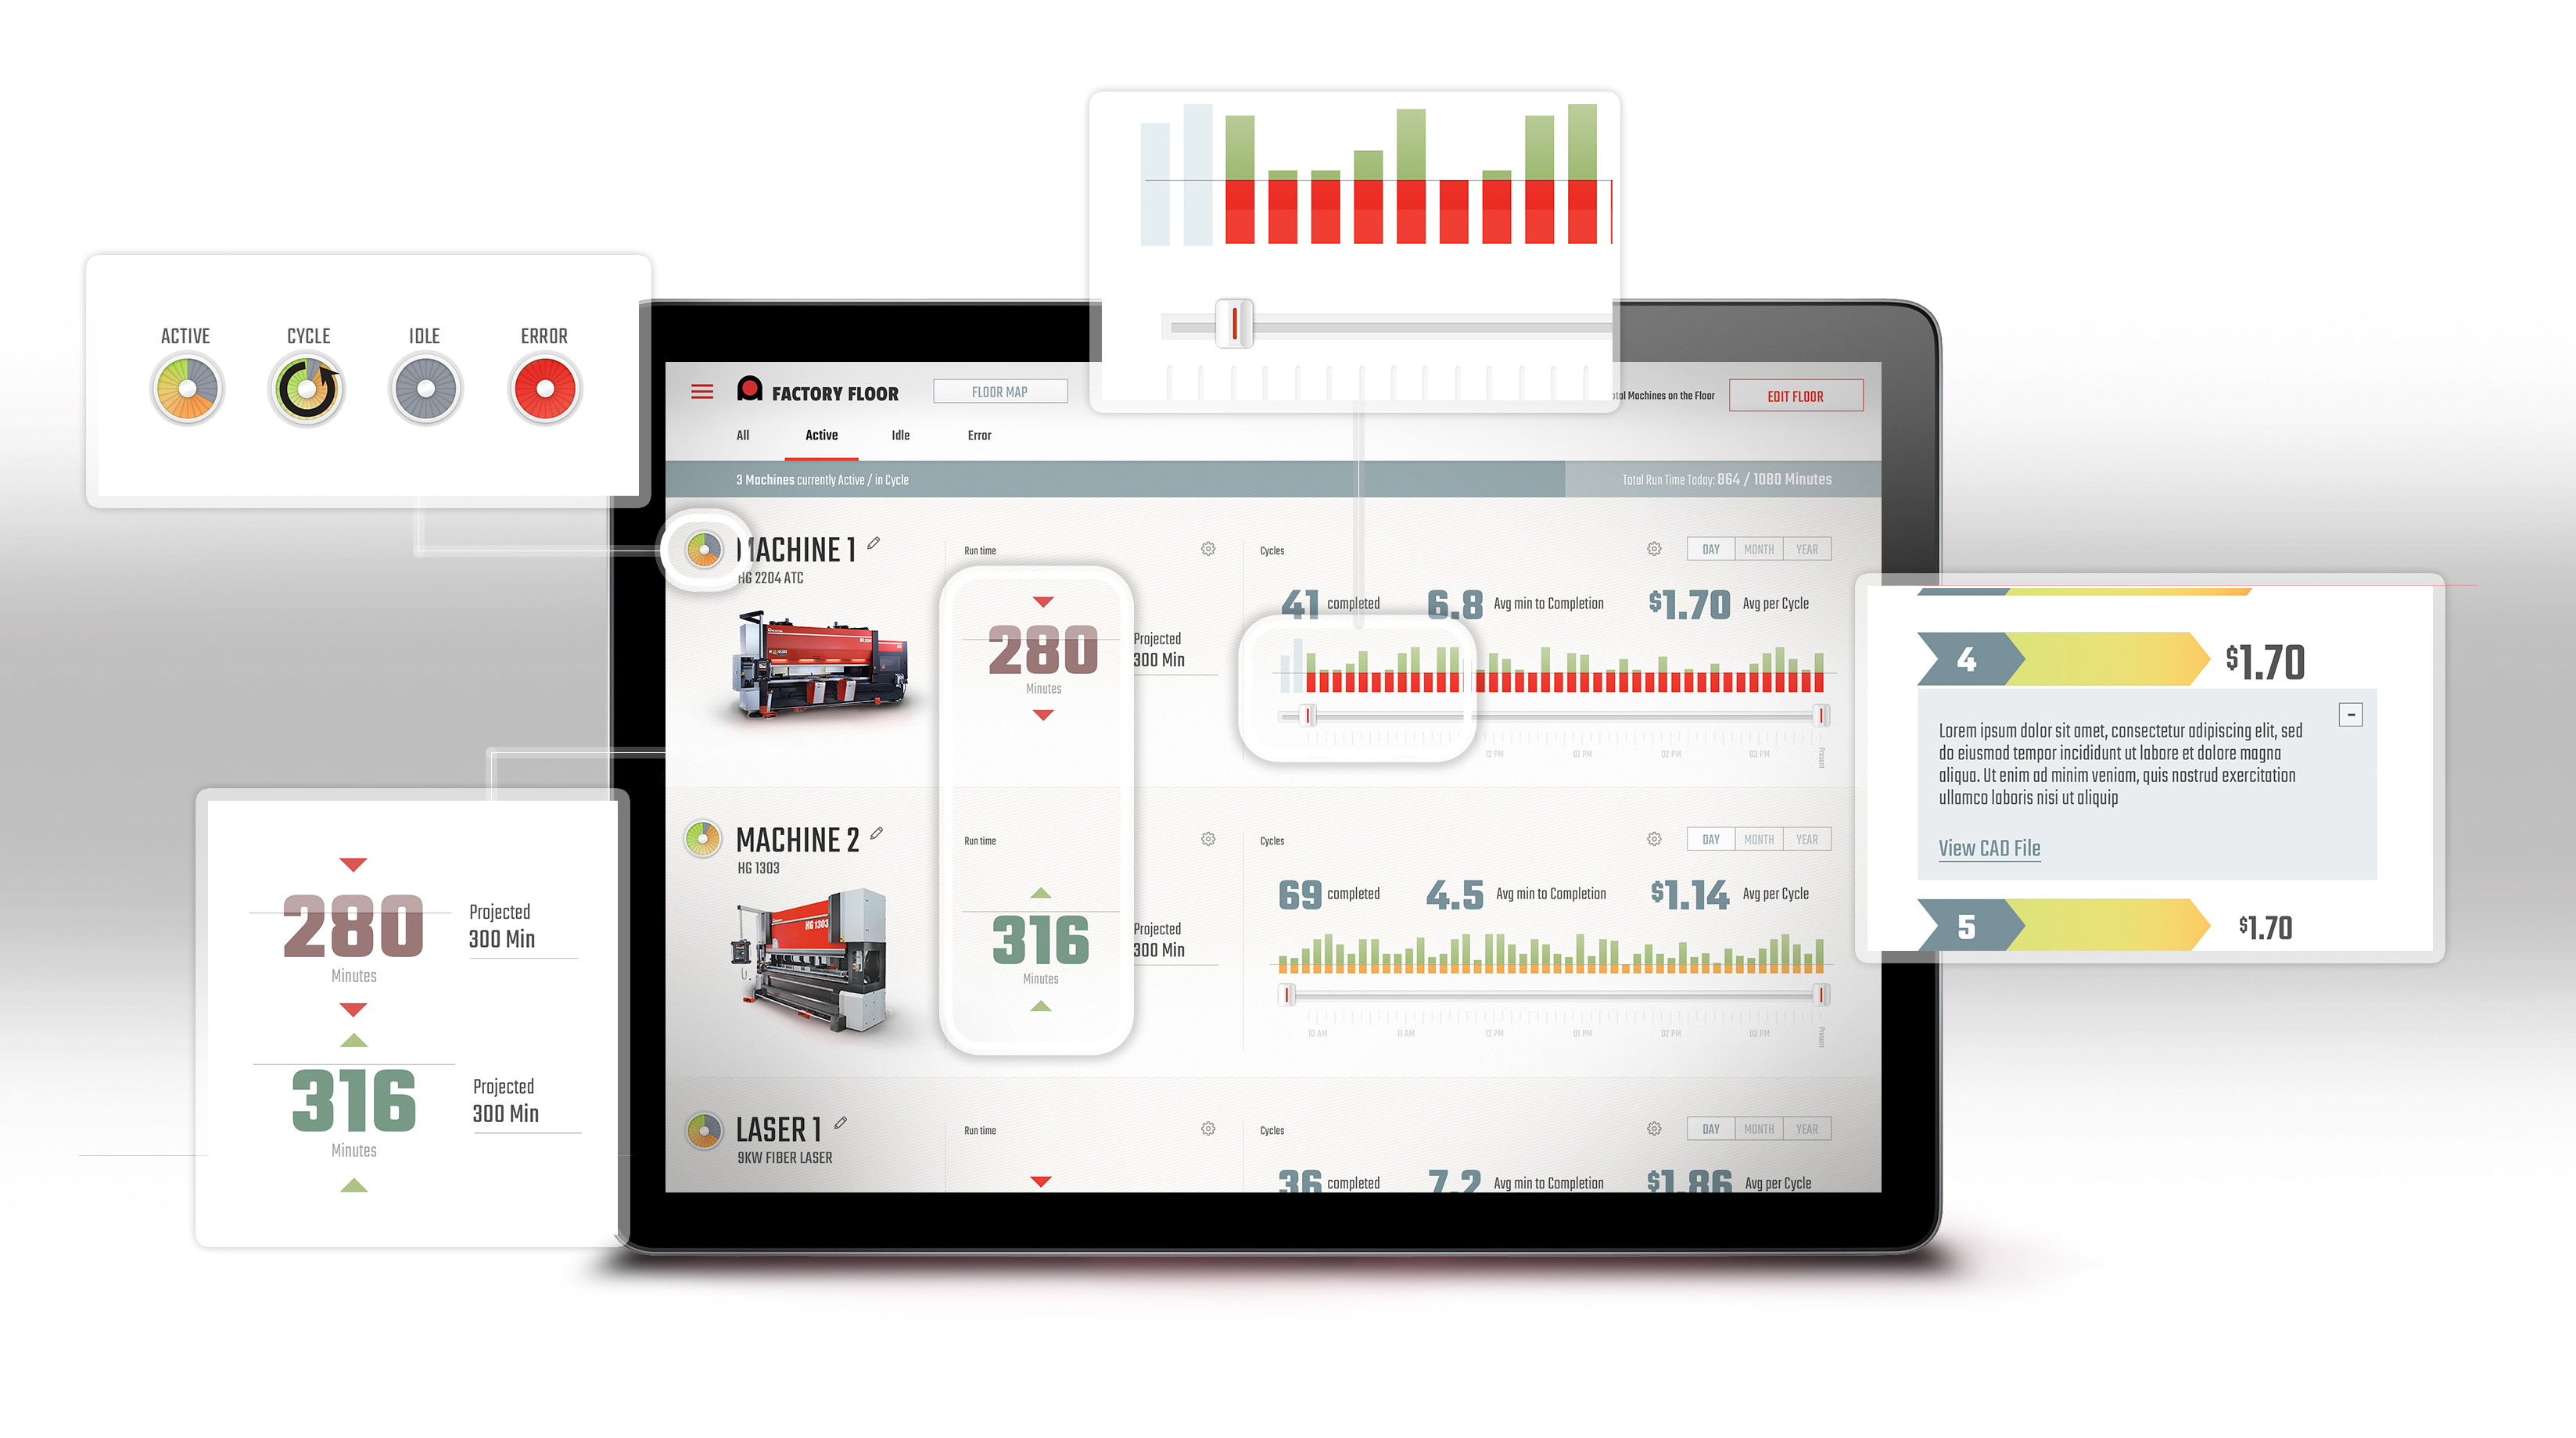
Ultimately I proposed a data-rich solution that focused on the collection of machines present in each specific factory instance.
From that point, I leveraged a data-visualization-heavy interface to help communicate a live story of what machines were doing, trends of their performance and real time errors that offered critical actions for users.
With this much data being potentially presented to a user in a potentially distracting environment, it was important to structure the experience in a way where more details, data and potential actions could be available by zooming in on any potnetial machine.
Related Case Studies
My ExperienceLeveraging user insights
Leading visioning
to influence Product strategy
My ExperienceLeading teams
AI Adoption
with Psychological Safety
My ExperienceStrategically Aligning
Users to Business Value
leveraging Discovery